Offering the Most Useful Business Insights with Excellent Data Visualization
Business Decision Making has been a process followed by organizations since forever. However, the way business decisions are made in today’s dynamic and competitive business environment is nowhere close to the process followed earlier.
The business environment earlier was not very fast and dynamic, people had fewer options, fewer choices, and taking business decisions was easier then. But in the current times, the scenario has changed with a complete 360degree revolution.
The business environment is competitive, it keeps changing, the opportunities are vast, and options before you are unending. Now, there is not a simple yes or no choice you have to make for the most of your business decisions. Instead, you are faced with situation where you have to brainstorm for hours, consider the options available to you, and even go out of your ways to look out for the choices and options that exist, but are not very clearly visible to you.
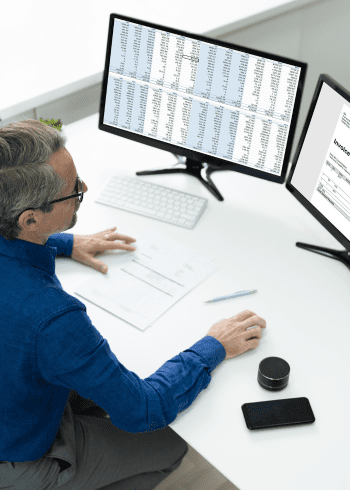
With all such operational scenarios, you need to have deeper business insights that help you study the market trends and practices through data analytics and unfold the opportunities, options, and choices available out there for driving business growth. Additionally, you need to keep a track of your workflows so that you can ensure that you are working at your best efficiencies with high operational performance.
Tableau is an efficient data visualization software catering to meet all your data management needs and requirements. We, at Zehntech Technology help you leverage the software for all its visualization capabilities with our robust, functional, and efficient Tableau Data Visualization Services.
Empowering Businesses Across The Globe
With Groundbreaking Technologies.
115+
Happy Clients
624+
Project Completed
32+
Technologies
168+
Expert Professionals
12+
Countries We Serve
What You Get With Tableau Data Visualization Services?
With our Tableau Data Visualization Services, you can have great capabilities to have your data presented in useful visual formats that are helpful for having the deeper business insights you need for faster and more efficient decision making.
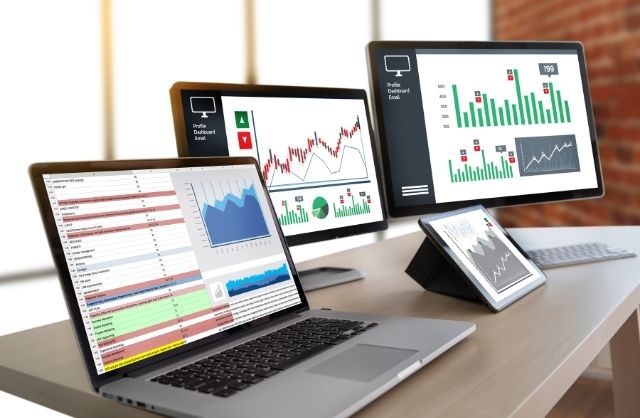
Graphs
Have your raw and discrete data presented in the form of graphs showing clear comparisons with detailed statistics for the latest market trends, operational performance, individual performance and a lot more.
Charts
Have a basic comparison on a number of parameters in an intelligible way by data visualization through detailed yet concise pie charts, scatter charts, line charts, and a lot more
Infographics
Get access to detailed and vast amount of data including statistics and other important parameters with the presentation of your important business data and other market trends in the form of highly informative and useful infographics.
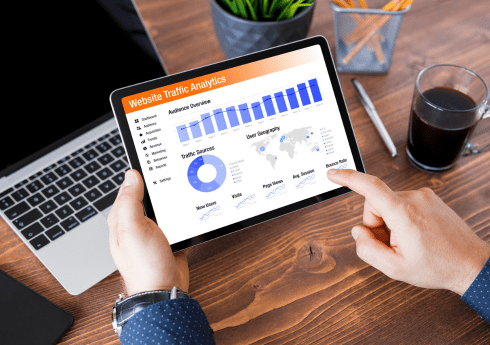
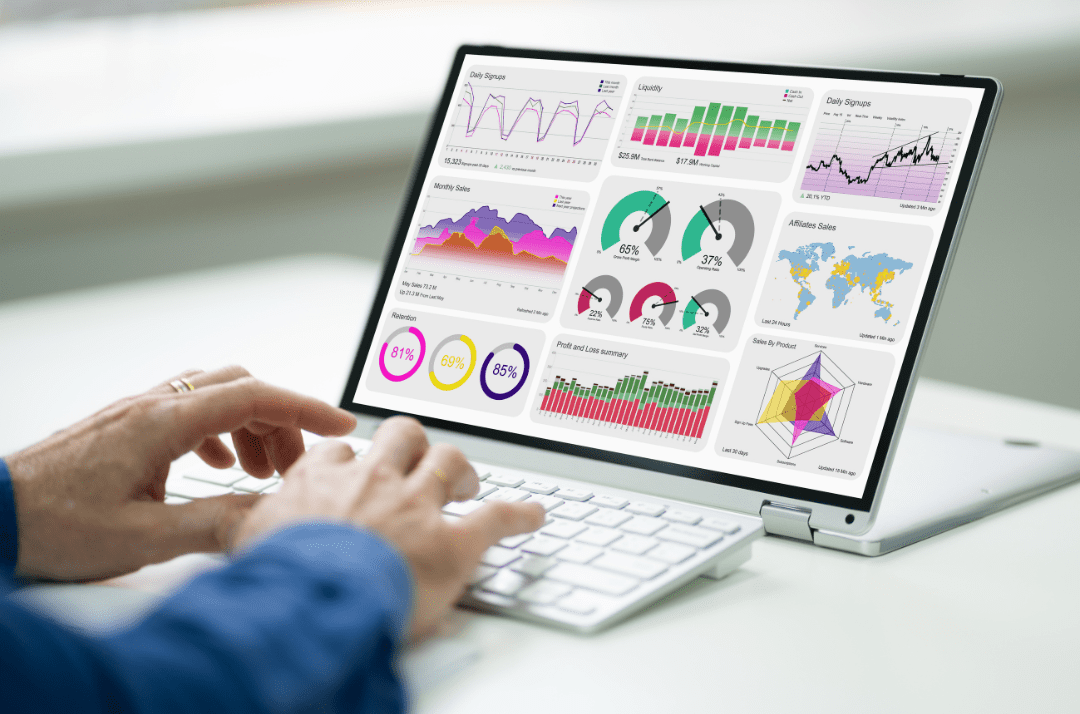
Dashboards
Have at a glance view of your important and discrete business data and information with its presentation on highly functional business dashboards.
Worksheets
Have a better view of your workflows and operational performance and manage it more efficiently through well-presented worksheets on Tableau Data Visualization Software.
Let's Turn
Your Ideas Into Profitable Ventures
Want to streamline & accelerate your digital transformation journey? Let's take on your business challenges together
Data Visualization provides tremendous business advantages and Tableau comes as the best software for leveraging the best capabilities and advantages of it. Here’s why taking Tableau Data Visualization Services is in your favor.
Accurate and More Efficient Data Analytics
With better presentation of your data through efficient visualizations, you are able to perform your data analytics functions more efficiently thereby getting more accurate and perfect business insights.
Faster and Efficient Decision Making
With Tableau Data Visualization Services, you have all your data well-presented. This caters to better data analysis in quick time thereby helping with faster and more efficient decision making.
Enhancing Business Performance
With Tableau, you can have at a glance view of all your operations and their overall as well as individual performance. This makes it easier to track issues and shortcomings, fix them, and keep enhancing the business performance for higher productivity and profitability.
Gaining Competitive Edge
Using Tableau Data Visualization Services, you get deep and detailed business insights into the market trends and patterns thereby opening up newer opportunities for you. With such abilities, you can stay ahead of your competitors and gain a competitive edge in the marketplace.
How We Work
First Contact
In the initial discussion, we learn about your business, offerings, goals, challenges, & expectations.
Requirement Documentation
Key project requirements & deliverables are mutually decided & documented.
Product Development
All team members use their technological prowess, expertise, & experience to provide solutions as per business requirements.
Quality Checks & Assurance
The demo is put through vigorous quality checks & tests to ensure security & performance as per standards.
UAT, Remediation, & Enhancements
Your solution is tested by its intended audience before the final launch. Issues are fixed by experts & suggestions are accommodated.
Final Launch
After the success of UAT, the launch-ready product is handed over to you. We also provide support & training when you need it.
Convert Vision into Reality
Embrace the power of advanced technologies to achieve business goals faster. Talk to our technology experts today.
Even with its user-friendliness, working out on Tableau to leverage best of its capabilities requires deep technical knowledge on the part of the user. We have a team of experienced and expert Tableau professionals who are well versed with every aspect of Tableau Data Visualization Software and provide the most efficient Data Visualization Services and Solutions for it. With our Tableau Data Visualization Software, you can have all your data needs and requirements managed efficiently and cater to much faster decision making and lead business growth and success with more efficient business performance.