
Most sales dashboards are wrong by the time anyone looks at them.
Not wrong as in broken. Wrong as in stale. The deal your rep closed at 4pm Friday is not in the dashboard your VP opens Monday morning. The pipeline funnel your Sales Manager is presenting to the board reflects last week’s numbers, not this week’s reality. That 20-minute export-clean-upload routine you run every Thursday? It expires before the meeting ends.
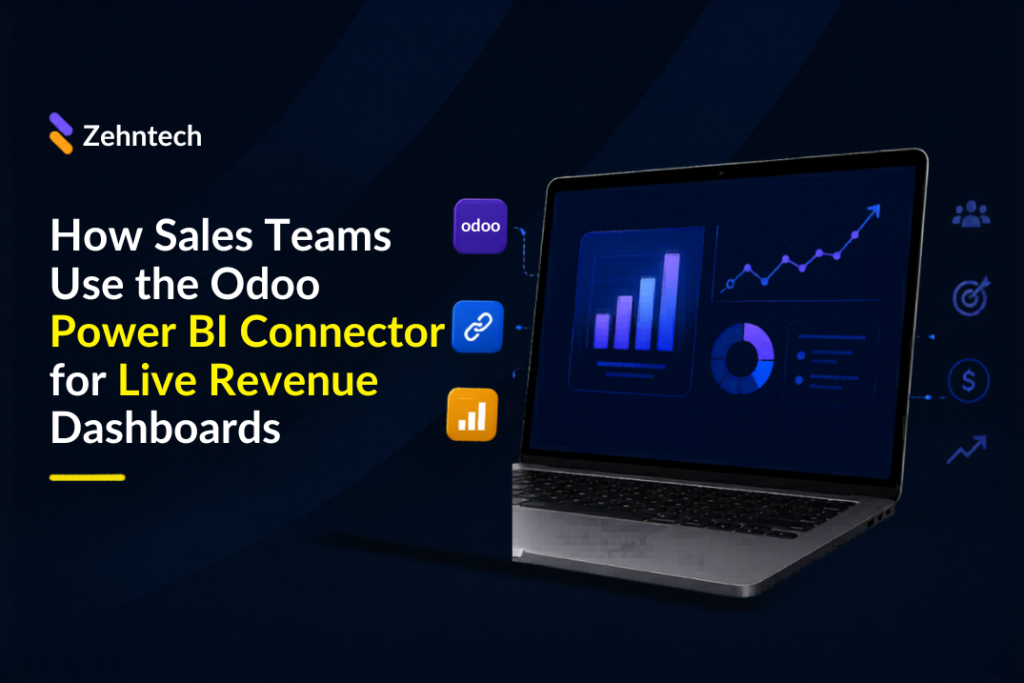
This is not a technology problem. It is a connection problem. Odoo holds your sales data. Power BI is where leadership wants to see it. The gap between them is costing your team time it does not have.
The Zehntech Odoo Power BI Connector closes that gap. This guide shows exactly how a sales team uses it – from the first time a Sales Manager opens a live dashboard to the moment Finance reconciles invoiced revenue without chasing anyone for a spreadsheet.
If you want the full technical setup first, read the complete Odoo to Power BI setup guide before coming back here. This post focuses on the sales use case specifically – what to sync, what to build, and what the team’s day looks like after it is live.
One more thing worth saying upfront: a Power BI consultant charges $150 an hour. A typical custom Odoo-to-Power BI integration runs 30 to 40 hours. That’s $4,500 to $6,000 before the first dashboard loads. The connector costs $122.09 one time.
Why Odoo’s Built-in Reporting Falls Short for Sales Teams
This is not a criticism of Odoo. Odoo’s list views, kanban boards, and pivot tables are genuinely useful for managing day-to-day sales operations. They are built for the person working the pipeline, not the person reviewing it.
The Sales VP does not want to click through a kanban board to understand monthly revenue trends. The Sales Manager does not want to export a pivot table and rebuild it in Excel every Friday. Finance does not want to reconcile invoiced revenue from a screen designed for sales reps.
Odoo ERP and CRM implementation gives you the data. It does not give you the reporting layer that leadership expects. That’s what Power BI is for – and that connection has historically required either a manual export ritual or a five-figure consultant engagement.
Understanding this gap is part of a wider pattern. Teams that get the most out of Odoo are the ones who separate operational tools from reporting tools. If you want context on how Odoo is transforming business operations in 2026, the reporting gap is one of the first things that comes up.
The weekly export ritual most sales teams are still running
Here is what the manual process looks like, written out plainly:
- Go to Odoo Sales or CRM
- Export to CSV
- Open the file in Excel – fix the column headers, reformat the dates, remove blank rows
- Open Power BI, replace the old data source with the new file
- Rebuild any broken relationships
- Refresh the dashboard
- Share with the team
- Repeat next Thursday
The whole thing takes 20 to 45 minutes. Then a deal closes two hours later and the dashboard is already wrong.
What to Sync – The Odoo Sales Fields That Matter in Power BI
Before building anything in Power BI, you need to decide what to expose from Odoo. The connector supports multi-model sync – you select which modules and fields go through.
For a sales team, start with these two modules:
Odoo CRM (Opportunities)
- Opportunity Name
- Pipeline Stage
- Expected Revenue
- Close Date (Expected)
- Probability
- Sales Team
- Sales Representative (Assigned User)
- Creation Date
- Last Activity Date
- Customer (Partner)
- Any custom fields your team has added – deal type, contract value, renewal date, customer vertical
Odoo Sales (Orders)
- Order Number
- Customer
- Order Date
- Confirmation Date
- Order Total
- Sales Team
- Sales Representative
- Product Lines (if you want product-level breakdowns)
- Invoice Status
You do not need to sync everything. Start with these fields. Once the dashboard is running, you can map additional fields without rebuilding the authentication setup.
Setting Up the Connector for Sales
Step 1 – Install the connector
In Odoo, go to Apps, search for the Zehntech Power BI Connector, and install it. No restart required.
Step 2 – Create your API token
Go to Settings ? Technical ? API Keys. Create a new private app token. Copy it. This is the only credential the connector needs – no password, no OAuth flow.
Step 3 – Configure the connection
Enter your Odoo instance URL and the API token. Select CRM and Sales as your sync models. Save.
Step 4 – Choose DirectQuery
For a live sales dashboard, DirectQuery is the right choice. Every time a sales manager opens the report, Power BI queries Odoo directly. A deal that moved stages 10 minutes ago is already in the dashboard.
Scheduled export is available for teams that prefer daily batch updates – useful for large datasets or environments where real-time querying would affect Odoo’s performance. For most sales teams, DirectQuery is the better option.
Step 5 – Map your fields
Select the CRM and Sales fields listed above. Save the mapping.
Total setup time for the Sales module: 1 to 2 hours, including the time it takes to build your first report.
The Dashboard – Four Reports Worth Building First
Open Power BI Desktop. Under Get Data, select your configured Odoo connector. Your CRM and Sales data appears as tables.
These are the four reports that deliver immediate value for a sales team:
1. Monthly revenue trend
A bar chart with Order Date on the X axis and Order Total on the Y axis, grouped by month. Add a line overlay for the previous year if you have historical data. This tells leadership whether revenue is growing, flat, or declining – without anyone touching a spreadsheet.
2. Pipeline by stage
A funnel chart showing the number of open opportunities at each CRM stage, with total expected revenue per stage as a secondary value. This is the report sales managers check every Monday. With DirectQuery active, it reflects the actual pipeline state at the moment they open it – not Thursday’s export.
3. Sales rep performance
A bar chart comparing revenue or pipeline value by sales representative. Add a slicer for date range and sales team. This is the report the Sales VP uses in one-on-ones and team reviews. Building it in Power BI takes about 15 minutes once the data is connected.
4. Win rate by stage
A calculated measure showing the percentage of opportunities that progressed from each stage to Closed Won. This takes a bit more work to set up in Power BI’s DAX formula language, but it surfaces the part of the pipeline that is leaking – which no Odoo default view shows clearly.
Apply Power BI’s native filters across all four reports: date range, sales team, individual rep, customer, product category. Once the filter panel is set up, every report becomes interactive without any additional configuration.
What the Sales Team’s Day Looks Like After Go-Live
This is the part that actually matters.
Monday morning. The Sales VP opens Power BI. The revenue dashboard is current to the minute – including anything that moved over the weekend. No one had to run an export. No one had to answer a Slack message asking for the latest numbers.
Mid-week deal movement. A deal moves from Proposal to Negotiation in Odoo. The pipeline funnel in Power BI updates immediately. The Sales Manager’s forecast does not need a manual refresh to reflect it.
Thursday afternoon. Instead of spending 30 minutes exporting and cleaning data, your analyst builds a new report slice. The time saved compounds every week.
End of month. The Sales Manager presents the monthly review. Every number on the screen is live Odoo data. No one asks “is this current?” because the answer is obviously yes.
Monthly finance reconciliation. Finance opens the same Power BI dashboard to reconcile invoiced revenue. The figures match Odoo exactly. No one emails anyone asking for “the latest version of the sales export.”
Extending Beyond Sales
Once the Sales and CRM sync is running, adding other modules takes minutes – no new authentication, no new configuration from scratch.
Add Inventory. See current stock levels next to your sales pipeline. Spot which products are selling fast but running low before it becomes a delivery problem. This matters more than most sales teams realize until they have missed a delivery commitment.
Add Accounting. Compare invoiced revenue against collected revenue in one dashboard. This is the report that ends the monthly back-and-forth between Sales and Finance about whose numbers are right.
Add custom fields. If your team has added fields to Odoo CRM – renewal dates, customer tiers, contract types – the connector maps them dynamically. They sync alongside your standard fields without any additional setup.
One connector configuration manages all modules at once. No separate export scripts, no separate scheduled jobs, no separate maintenance window.
For teams that want to extend reporting beyond Power BI – into Tableau, Qlik, or Snowflake – Zehntech’s data analytics and visualization services cover the full stack.
Common Questions from Sales Teams
Does DirectQuery slow down Odoo?
For most sales teams, no. DirectQuery runs read-only queries when a report is opened – it does not run continuously in the background. If your Odoo instance handles hundreds of concurrent users, test the performance impact before rolling out to the full team. For teams under 100 users, this is not a practical concern.
Can different reps see only their own data?
Yes. Power BI has row-level security (RLS) that lets you restrict what each user sees based on their login. You can configure this so reps see their own pipeline, managers see their team, and the VP sees everything. This is a Power BI configuration, not a connector configuration – it works the same way regardless of data source.
What happens if the connector goes down?
If the connector loses connection to Odoo, Power BI shows the last successfully cached data with a timestamp. Users see a stale dashboard rather than a broken one. The connector reconnects automatically once the issue resolves.
Does this work with Odoo Community edition?
Yes. The connector supports Odoo Community and Enterprise across versions 16, 17, 18, and 19. It works with Odoo Online, Odoo.sh, and self-hosted On-Premise deployments.
How long does it take to get the first dashboard live?
For a sales team starting from scratch, plan for one focused day: setup and authentication in the morning, field mapping and first reports in the afternoon. Most teams have a working sales dashboard by end of day one.
What support is included?
90 days of free support is included with the connector purchase – covering installation, authentication, field mapping, and troubleshooting. Contact: odoo-support@zehntech.com.
The Practical Bottom Line
A Power BI consultant charges $150 an hour. Getting a custom Odoo-to-Power BI integration built typically takes 30 to 40 hours of that consultant’s time – call it $4,500 to $6,000, before the first dashboard loads and before any change requests.
The connector is $122.09 one time.
The setup takes a day instead of weeks. The data is live instead of delayed. And when a sales rep asks “is the dashboard current?” the answer is yes – because it pulls directly from Odoo, not from a file someone exported last Thursday.
Install the Odoo Power BI Connector – $122.09 one-time
For the full technical setup walkthrough, read: How to Connect Odoo to Power BI – Complete Setup Guide
- Why Odoo's Built-in Reporting Falls Short for Sales Teams
- What to Sync - The Odoo Sales Fields That Matter in Power BI
- Setting Up the Connector for Sales
- The Dashboard - Four Reports Worth Building First
- What the Sales Team's Day Looks Like After Go-Live
- Extending Beyond Sales
- Common Questions from Sales Teams
- The Practical Bottom Line